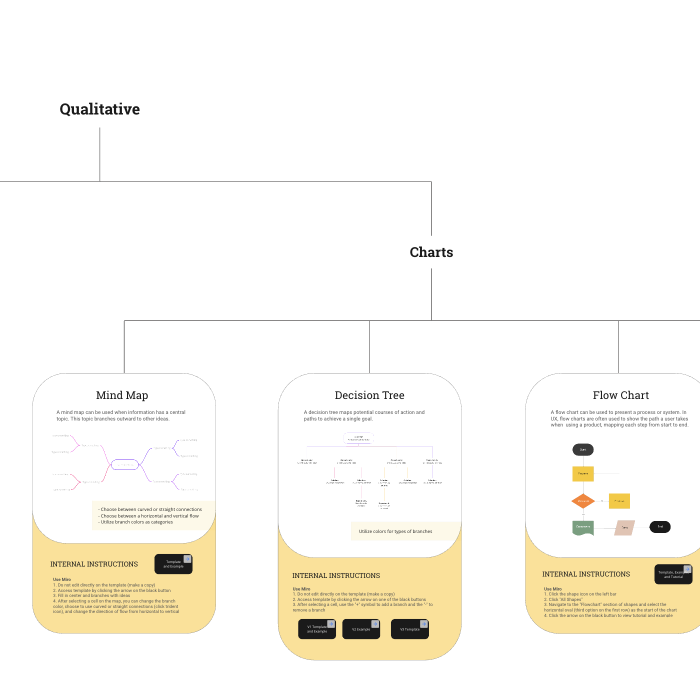
The following is a tool I built to make the UX research and analysis reporting process more efficient.
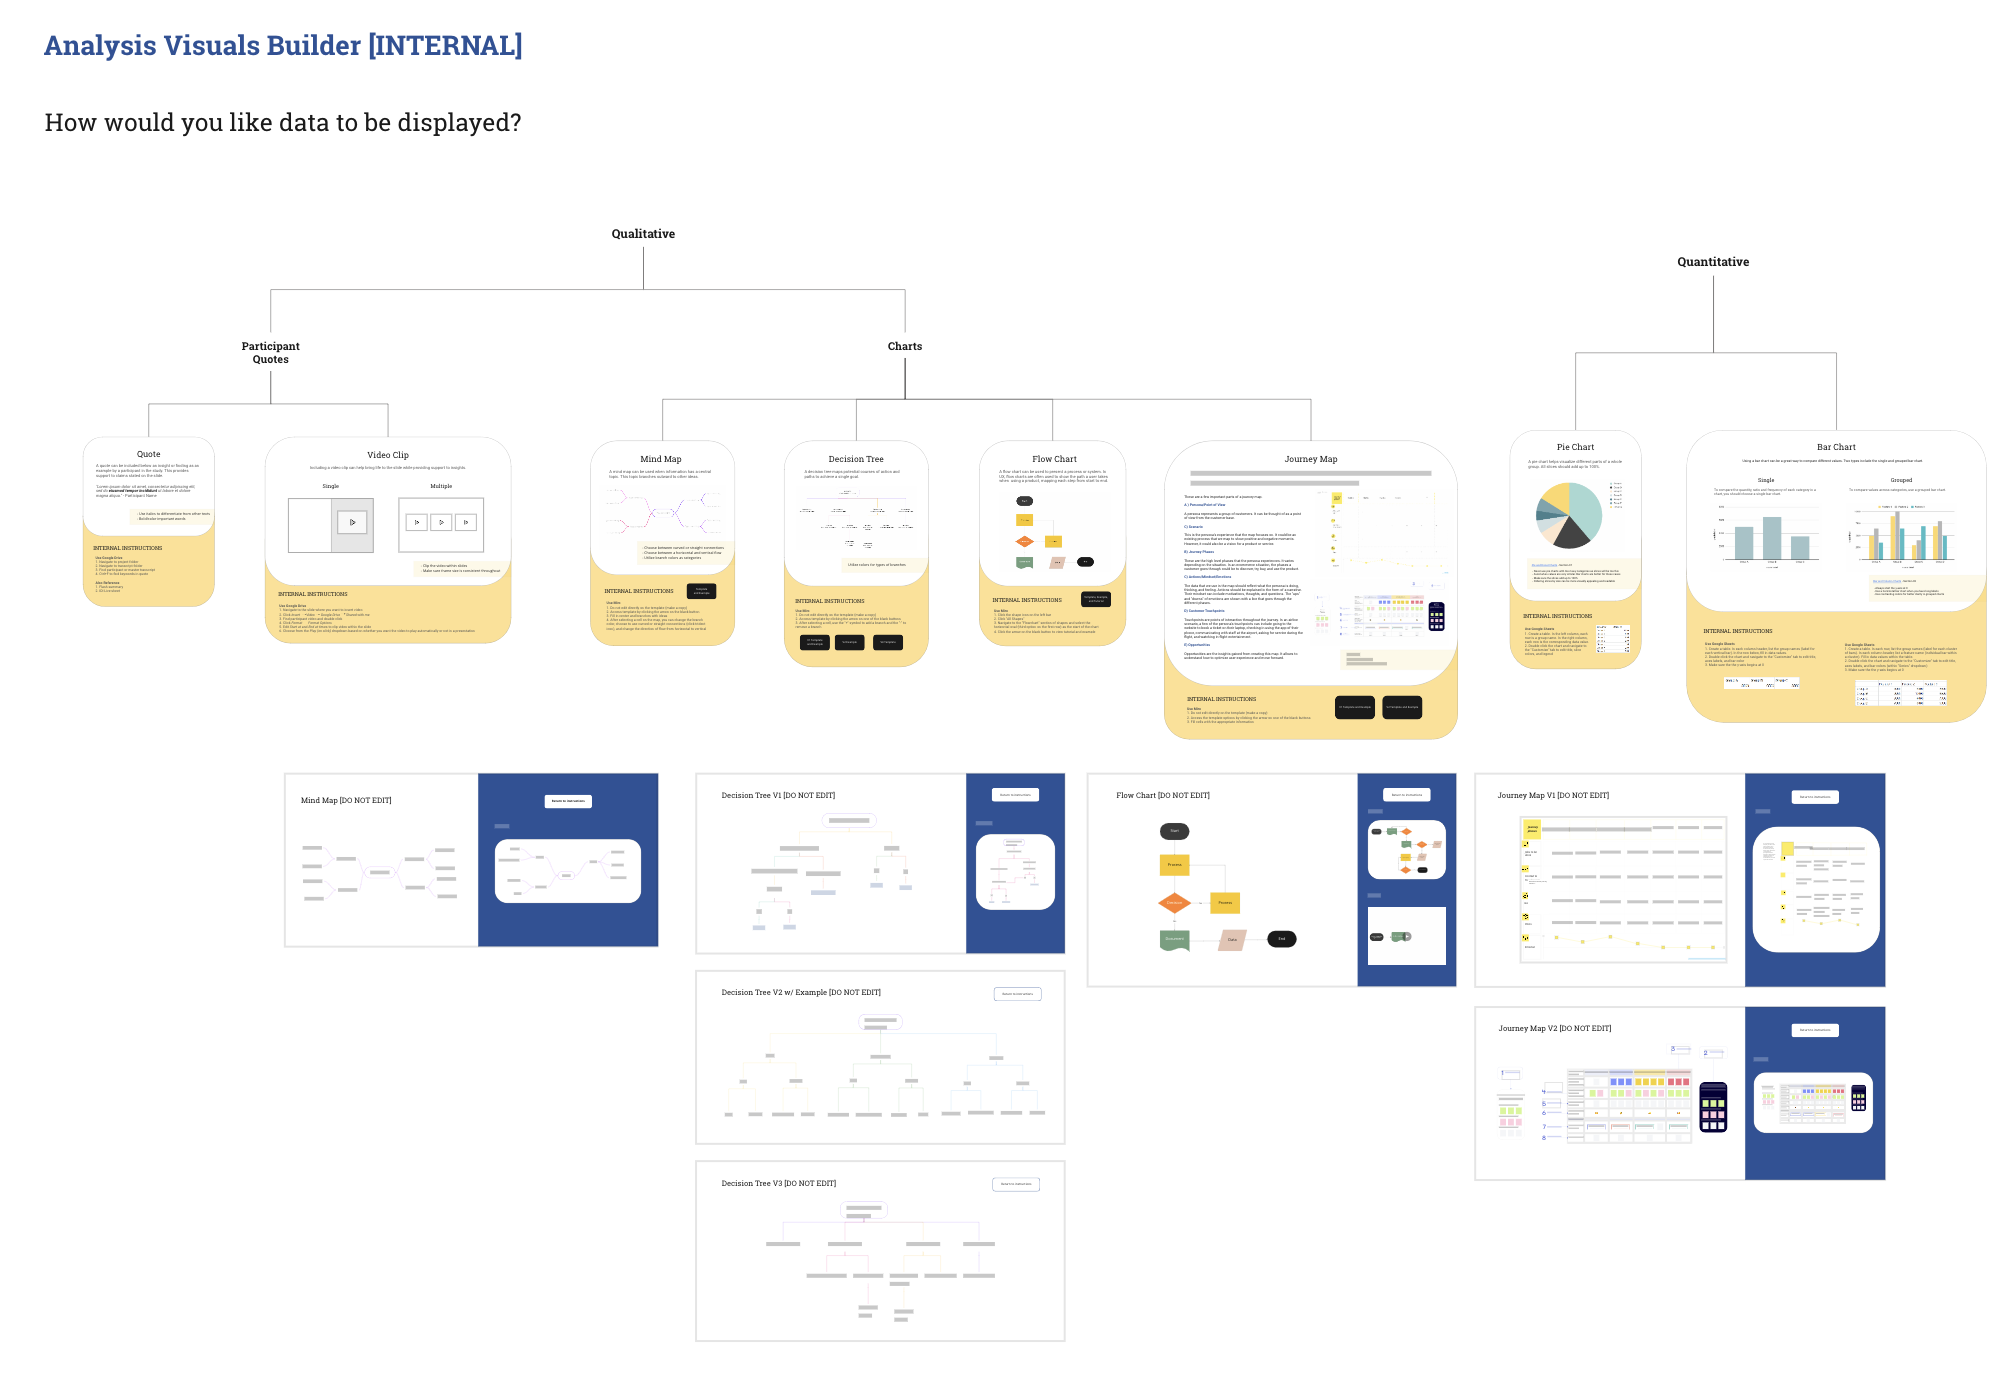
First, the chart is split into visuals ideal for Qualitative and Quantitative data. Within the Qualitative section, there are two categories, "Participant Quotes" and "Charts". Each tab within walks you through the steps and use cases of different visuals.
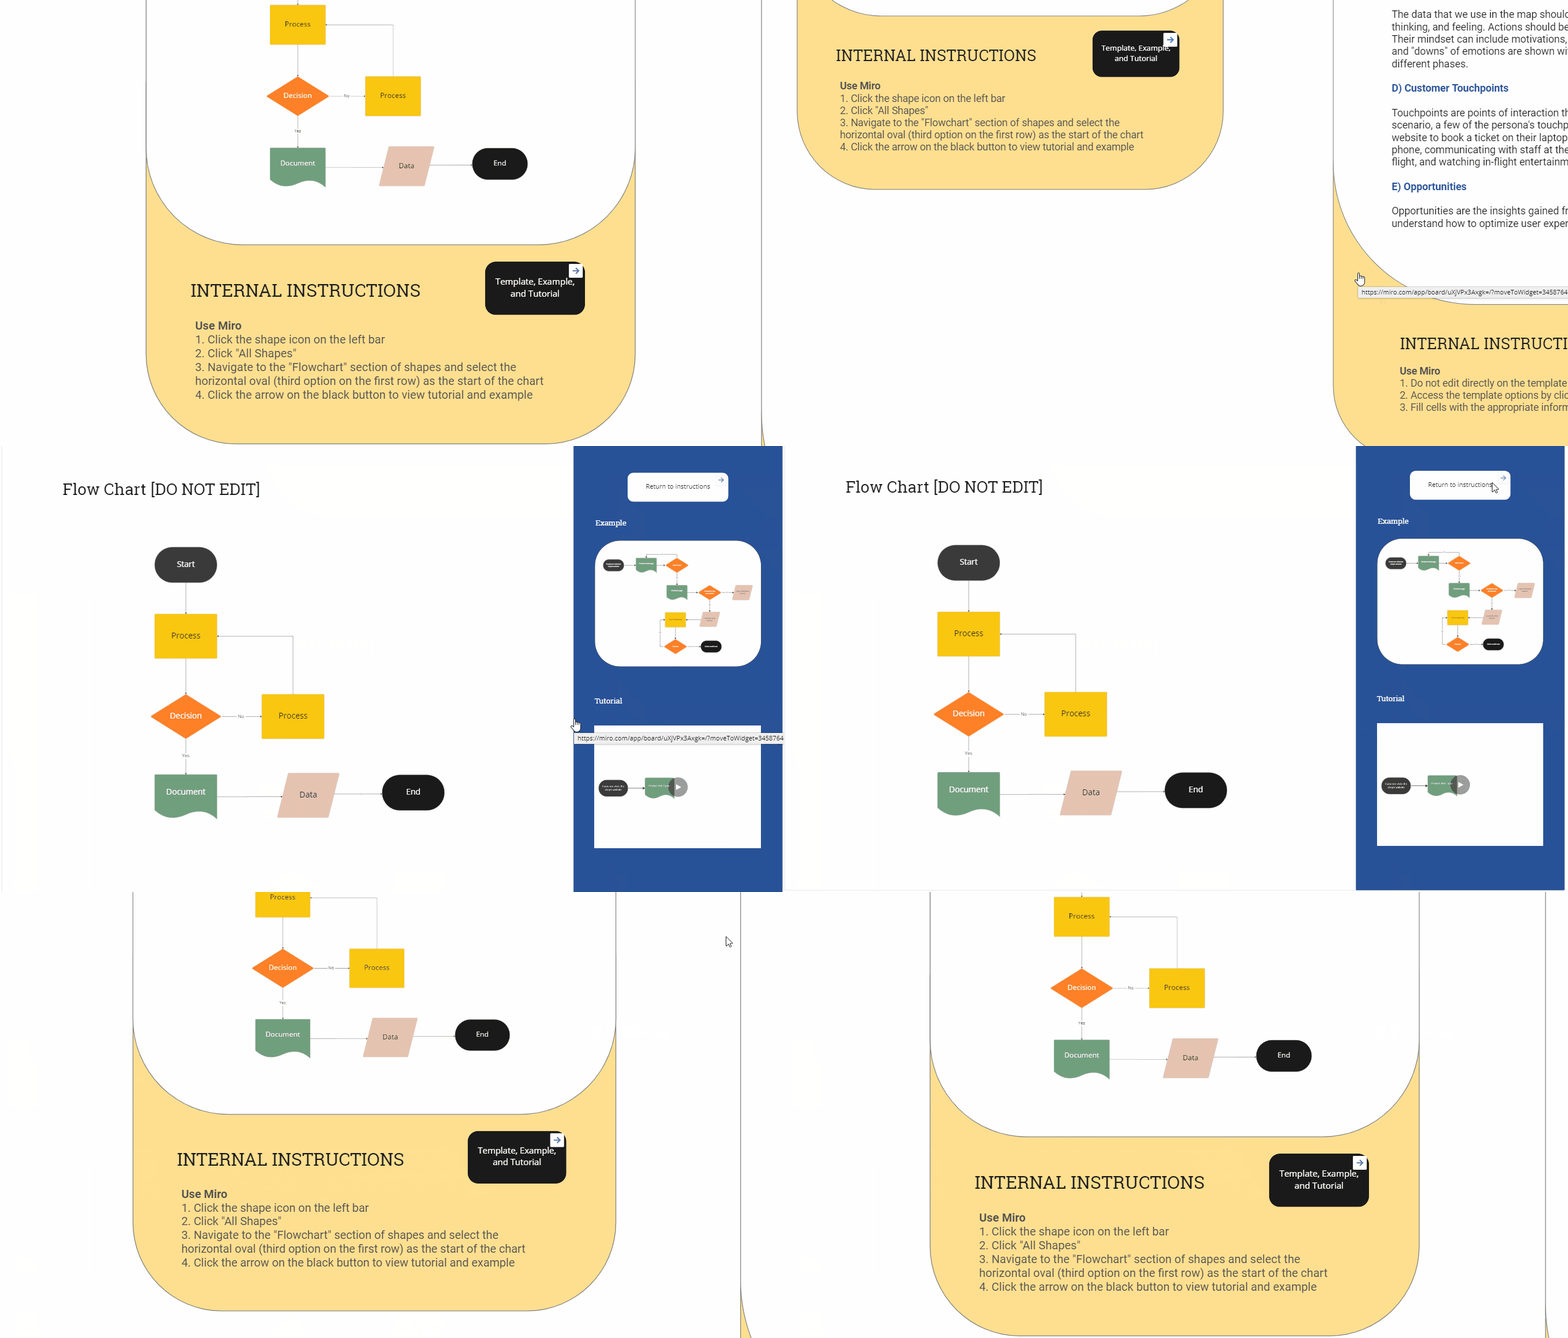
When you click the arrow in the black button, it takes you to a section of the board with templates for use.
Click this
link to interact with the Miro board!